Open House Wednesdays at Location One
Attended the Open House Wednesday for
 on 4.13.05
Every second Wednesday, Location One hosts a speaker who selects a theme to speak about.
The speaker was Heather Wagner who presented a discussion on Data Mapping and Data Visualization.
The outline of the talk was as follows:
Two types of data
1.Static
-graphs
-swallowable format
2.Dynamic
-constantly changing
-feed is coming from a dynamic source, which changes the representation
Data mapping and Data Visualization is about making visible what is invisible as well as organizing ideas for clear representation
Examples of Static Data
1. The Harper's Index
The Harper's Index features a series of numbers that represent various statistics. The order and context of the numbers presented in the index makes the viewer rethink the value of the information being presented.
2. Edward Tufte is a rennown data theorist/information designer. His books are not only beautiful but illustrate information in effective ways. He also believed that the structure of a Powerpoint presentation was to blame for the Columbia Space Shuttle disaster. The size of the foam that struck the Shuttle's Wing was 640 times larger than the research on which their calculation was based. Since this information was placed on the last slide, this information was considered minor by the viewers. Link to article
3. The Money Counter by John Maeda
Maeda created a comparison using
 sign icons to show the difference between the money spent on science vs art, nuclear energy vs alternative etc.
 4. Data Dynamics (March-June 2001) was the first exhibition curated by Christiane Paul at the Whitney that featured work that demonstrated the ability to create context and meaning for ideas within the shifting landscape of information.
5. The Secret Lives of Numbers by Golan Levin (This man has one of the the most intimidating resumes I have ever seen)
A visualization of numbers and their popularity. This work is an interactive application that shows the popularity of every integer between 0 and 10,000,000
Examples of Dynamic Data
1. Dolls powered by the Dow Jones
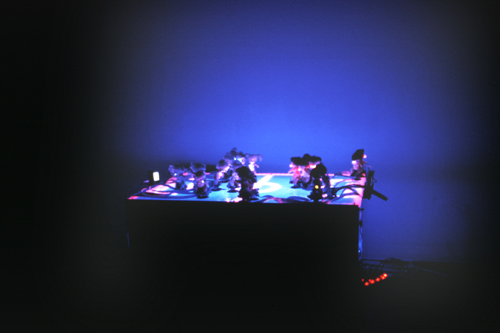
From the artists document:
Two teams of dolls are placed on the soccer field model (blonde team/brunette team). The computer controls the two teams and each team member is linked to the actions of a Dow Jones' stock. Every 15 minutes the computer logs-in to a stock quote provider on the internet and downloads the most recent quotes. According to changes in the stocks' values, different commands are directed to the dolls: the breasts will flash, speech samples are triggered, melodies are played, etc.. The loudspeaker glued to the doll's feet faces the surface of the soccer field model and a little motor causes the figures to move in random patterns across the field: a strange ballet of blondes and brunettes with flashing breasts performs a hybrid theater piece which is conducted by the virtual organism of the Dow Jones.
The acoustic material is taken from an educational tape from the seventies with the title 'Audray's First Million' for the brunettes and from a pornographic audio tape for the blondes.
The goals of the field are replaced by the two little LCD-monitors. A soothing slow motion animation is shown. During this mesmerization the monitors display the latest stock quotes ('ticker tape').
A surreal simulation by double-simulators (naked dolls as actors who play soccer) stimulated by economic simulators and indicators (Wall Street's money games as simulation and indication of the economy) emerges - a simulacrum to the 4th power.
2. Spore 1.1 Swamp

A self sustaining eco-system rubber tree purchased from Home Depot. If Home Depot Stock performed well, the plant would get watered. If Home Depot Stock did not perform well, plant would not get watered. This piece illustrates a good example of work that shows a strong relationship between the piece and data.
3. Listening Post


A piece by Mark Hansen and Ben Rubin. A display of LCD's that took data from the internet and displayed and spoke text input that was determined by an algorithm that selected what type of text to display based on a theme either from spaces on the internet such as chat rooms and search engine fields.
The current trend of data mapping is the use of dynamic data as a source. The relevance of visualizing dynamic data represents the current environment of the constant shift of information. Important relationships can be drawn from the display of data. Data visualization provides a rich context for the artistic exploration of information and what the implications are of the relationships that are found.
posted by Laurea @ 1:53 PM
0 comments
![]()
![]()
0 Comments:
Post a Comment
<< Home