Wednesday, April 27, 2005

Review of 2005 Boston Cyberarts Festival from NYTimes

All the annoyances of interactive art (prurience, ritual, ungraciousness and moral superiority) are on display at the 2005 Boston Cyberarts Festival. [New York Times: Arts]

Notable quotes from the article in order of their appearance:

1. "Interactive art is irritating. Let's count the ways at the 2005 Boston Cyberarts Festival"
2. "Is every piece of interactive art designed to make you feel like a fascist, a dupe, a cult member or someone cornered by a pervert at a party? No, of course not."
3."Alas, some cyberworks combine all the annoyances of interactive art (prurience, ritual, ungraciousness and moral superiority) to produce a mega-annoyance: total frustration. "
4. "What a relief to just stand there and watch the apocalyptic montage! No interaction. No instruction. No insults. "Parking is the most serious problem confronting 20th-century man," Mr. Paik once said in an interview about the silver Chrysler. Now we've got more serious problems on our hands."

Artist ->mauricio arango
Vanishing Point consists of a map of the world connected to a database fed by news coming from several international newspapers. The visibility of each country on the map results from the quantity of media coverage the country receives, so those countries that do not make the news disappear progressively.


The newspapers selected are some of the most widely-read from countries that make up the Group of Seven (G7), the seven most industrialized nations in the world.


The goal of this project is to decipher the world that news media reconfigures and to observe if media coverage, or lack thereof, is creating a new cartography.


This project was commisioned by Low-Fi The Net Art Locator in England. Its first gallery installation will be at Stills Gallery in Edinburg, Scotland, in August 2005. [more] [Rhizome.org Artwork]


A very elegant interface for investigating the frequency of a country's occurrence in the news from various international newspapers. A short background for the country is also provided. A piece like this is an expected departure from randomly displayed information from the internet (interfaces without much structure that adhere to a more dadaist collage aesthetic), in that it is an interface that is structured and updated, unlike most flash based projects which tend to be static.

Monday, April 25, 2005

Little Boy: The Arts of Japan's Exploding Subculture

Went to the Japan Society


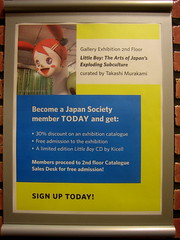
last Sunday to check out the Little Boy exhibit curated by Takashi Murakami. The exhibition focuses on work that is representative of Otaku culture. Common themes included large eyes, robots, hybird creatures, animations, and the struggle between adolescence and the emergence of sexuality.

The Japan Society exhibit space is not that large, however the interior of the space flows well from one area to another which prevents a feeling of being crowded. There was a lot of work in the Little Boy Exhibit but all the pieces were given their own ample space, which is usually not the case when an exhibit is featured in a small space with a lot of work.

The first striking piece that is visible even before the exhibition is Fresh Gasoline by Noburu Tsubaki. It is a large yellow organ looking blob with long, stiff tendrils that extend toward the ceiling of the space.


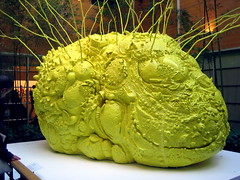
Styrofoam, Clay, Willow Branches and Paint

Upon entering the beginning of the exhibit, a large green robot called a Zaku head sits in the middle of the room making an intermittent sound as a pink eye rotates in its head. To the right of the Zaku head is a flat panel tv playing a loop of the Yuru Chara Show which features a variety of mascots parading onstage to different electronic music genres like techno version, downbeat version and trance version (even though the labeled genres did not match the music that was actually playing).

There was an entire wall dedicated to Hello Kitty that showed various Hello Kitty parphernalia; from Hello Kitty pillows to lunchboxes to figurines. It brought back my Hello Kitty obsession when I was younger. I used to collect Hello Kitty stationary that I would never write on, but I did write my childhood secrets in my Hello Kitty diary that had the easiest lock you could pick with a bent paperclip. An LCD TV was playing an intense motion graphics sequence of Hello Kitty's transformations from 1974 to 2005.

Aya Takano had an entire wall of her seemingly innocent girly figure acrylic on canvas pieces. When looking closer, some of the acrylic paintings are actually renderings of scenes like a torso fucking a stuffed animal with a black bunny watching, a used bloody tampon on the floor and a girl masturbating with crayons.

Shigeru Komatsuzaki was the first artist to create e-monogatari, which are serialized picture stories.

The images above were not in the Little Boy Exhibit, they are just examples of his work, which are incredibly detailed and have a bionic/superfuture aesthetic to them.

Doraemon, the "22nd century cat from the future" also had a presence in the form of an LCD TV and a sculpture.

An entire wall of black godzillas lined up the entrance to the second part of the exhibition. Behind the row of black godzillas was Article 9, the Declaration of War on Japan by the US. It was a very striking installation that raised issues of the atom bomb and how different Japan and its culture would be if the war never happened and the bomb were never dropped.


The second part of the exhibition featured a room that contained a glass box that took up an entire wall that was filled with vintage toys from brands like Kikkoman. In the room with the glass box full of vintage toys were these wooden baby sculptures with neon accents by Izumi Kato.

An entire wall was covered with the cells from the beginning of the Daicon IV animation.


Tohl Narita, the creator of Ultraman draws these crazy hybrid creatures like armadillo fish platypus creatures. I would think that
Kool Keith created his lyrics based on creatures that look like this.
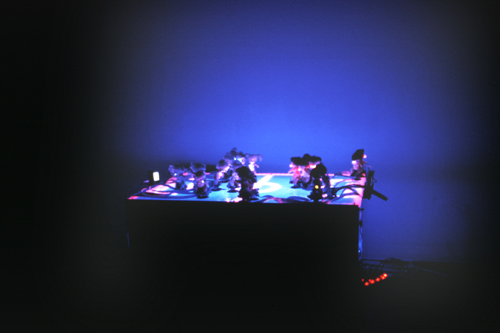

Atom Suit Project was the name of the piece that entailed a life size robot surrounded by miniature robots that beeped in the middle of the third part of the exhibition was made by Kenji Yanobe.


Sushi with etchings of naked women sitting on top of a woman shaped canvas was a very meta-commentary piece on women used as sushi platters.

The Little Boy Exhibit is a very accessible, colorful and fascinating exhibit that is installed extremely well. People that are Japanophiles are obvious fans for this show, but even if you aren't very informed about Japanese pop culture it is a very intriguing insight into Otaku culture

Wednesday, April 20, 2005

Open House Wednesdays at Location One

Attended the Open House Wednesday for
on 4.13.05

Every second Wednesday, Location One hosts a speaker who selects a theme to speak about.

The speaker was Heather Wagner who presented a discussion on Data Mapping and Data Visualization.

The outline of the talk was as follows:

Two types of data

1.Static
-graphs
-swallowable format

2.Dynamic
-constantly changing
-feed is coming from a dynamic source, which changes the representation

Data mapping and Data Visualization is about making visible what is invisible as well as organizing ideas for clear representation

Examples of Static Data
1. The Harper's Index
The Harper's Index features a series of numbers that represent various statistics. The order and context of the numbers presented in the index makes the viewer rethink the value of the information being presented.

2. Edward Tufte is a rennown data theorist/information designer. His books are not only beautiful but illustrate information in effective ways. He also believed that the structure of a Powerpoint presentation was to blame for the Columbia Space Shuttle disaster. The size of the foam that struck the Shuttle's Wing was 640 times larger than the research on which their calculation was based. Since this information was placed on the last slide, this information was considered minor by the viewers. Link to article

3. The Money Counter by John Maeda
Maeda created a comparison using sign icons to show the difference between the money spent on science vs art, nuclear energy vs alternative etc.

4. Data Dynamics (March-June 2001) was the first exhibition curated by Christiane Paul at the Whitney that featured work that demonstrated the ability to create context and meaning for ideas within the shifting landscape of information.

5. The Secret Lives of Numbers by Golan Levin (This man has one of the the most intimidating resumes I have ever seen)

A visualization of numbers and their popularity. This work is an interactive application that shows the popularity of every integer between 0 and 10,000,000

Examples of Dynamic Data

1. Dolls powered by the Dow Jones


From the artists document:
Two teams of dolls are placed on the soccer field model (blonde team/brunette team). The computer controls the two teams and each team member is linked to the actions of a Dow Jones' stock. Every 15 minutes the computer logs-in to a stock quote provider on the internet and downloads the most recent quotes. According to changes in the stocks' values, different commands are directed to the dolls: the breasts will flash, speech samples are triggered, melodies are played, etc.. The loudspeaker glued to the doll's feet faces the surface of the soccer field model and a little motor causes the figures to move in random patterns across the field: a strange ballet of blondes and brunettes with flashing breasts performs a hybrid theater piece which is conducted by the virtual organism of the Dow Jones.
The acoustic material is taken from an educational tape from the seventies with the title 'Audray's First Million' for the brunettes and from a pornographic audio tape for the blondes.

The goals of the field are replaced by the two little LCD-monitors. A soothing slow motion animation is shown. During this mesmerization the monitors display the latest stock quotes ('ticker tape').

A surreal simulation by double-simulators (naked dolls as actors who play soccer) stimulated by economic simulators and indicators (Wall Street's money games as simulation and indication of the economy) emerges - a simulacrum to the 4th power.

2. Spore 1.1 Swamp


A self sustaining eco-system rubber tree purchased from Home Depot. If Home Depot Stock performed well, the plant would get watered. If Home Depot Stock did not perform well, plant would not get watered. This piece illustrates a good example of work that shows a strong relationship between the piece and data.

3. Listening Post


A piece by Mark Hansen and Ben Rubin. A display of LCD's that took data from the internet and displayed and spoke text input that was determined by an algorithm that selected what type of text to display based on a theme either from spaces on the internet such as chat rooms and search engine fields.

The current trend of data mapping is the use of dynamic data as a source. The relevance of visualizing dynamic data represents the current environment of the constant shift of information. Important relationships can be drawn from the display of data. Data visualization provides a rich context for the artistic exploration of information and what the implications are of the relationships that are found.

Monday, April 11, 2005

Richard Rinehart | Reading Class

From Rhizome:
Artist ->Richard Rinehart
Reading Class is what Joseph Beuys called "social sculpture"- engagement with the intangible elements that shape our lives. Reading Class uses social software to explore the social question of class. Specifically, Reading Class is a multimedia game built inside an Internet blog; a blog being a set of standards and software used for online personal journals or conversation. Reading Class explores the idea of class as an semi-emergent taxonomy, a self-organizing system, by taking participants on a journey of cultural choices and values where their own class identity is measured against fixed scholastic markers and against the relativistic play and perception of other participants as measured in real-time (the taste culture choices you make while you play affect the final class score of other players during this project, and vice versa). Reading Class strives to be journal and discussion forum - a cultural engine for revealing, exploring and critiquing social class. [more] [Rhizome.org Artwork]

This piece attempts to engage the user in the exploration of their own social class through a series of questions. The answers to the questions attempt to quantify the social class of a user based on their answers. After a user answers a question, a summary of what type of class each answer is from is provided. This piece is a combination of the examination of class through American ideals and perceptions.

Some of the most interesting perceptions of class brought up by this piece include:
-The presence of televisions in living rooms. The more obvious the presence of a television, as far as display and being turned on in a living room, the lower the class level of the people in the household.
-People with two car households tend to live longer than households with one car
-People from higher classes will tend to have expensive relics from religions that are oppressed and that they would never practice
-People with money will make statements that rank cleverness as priority over wealth

The appearance of sailing as an experience in relation to higher classes is prevalent in the quiz.

Users are invited to make comments after every question in order to produce a dialogue about a specific theme in the test.